How AI-Driven Data Analysis Improves Business Performance: A Review of the Evidence
What 19 studies, experiments and statistical releases show about AI, data analysis and business results, with Canada's Q2 2026 adoption figures, plain-English methods and a clearly hypothetical impact calculator.
By Akbar Mohseni, PhD · · 12 min read
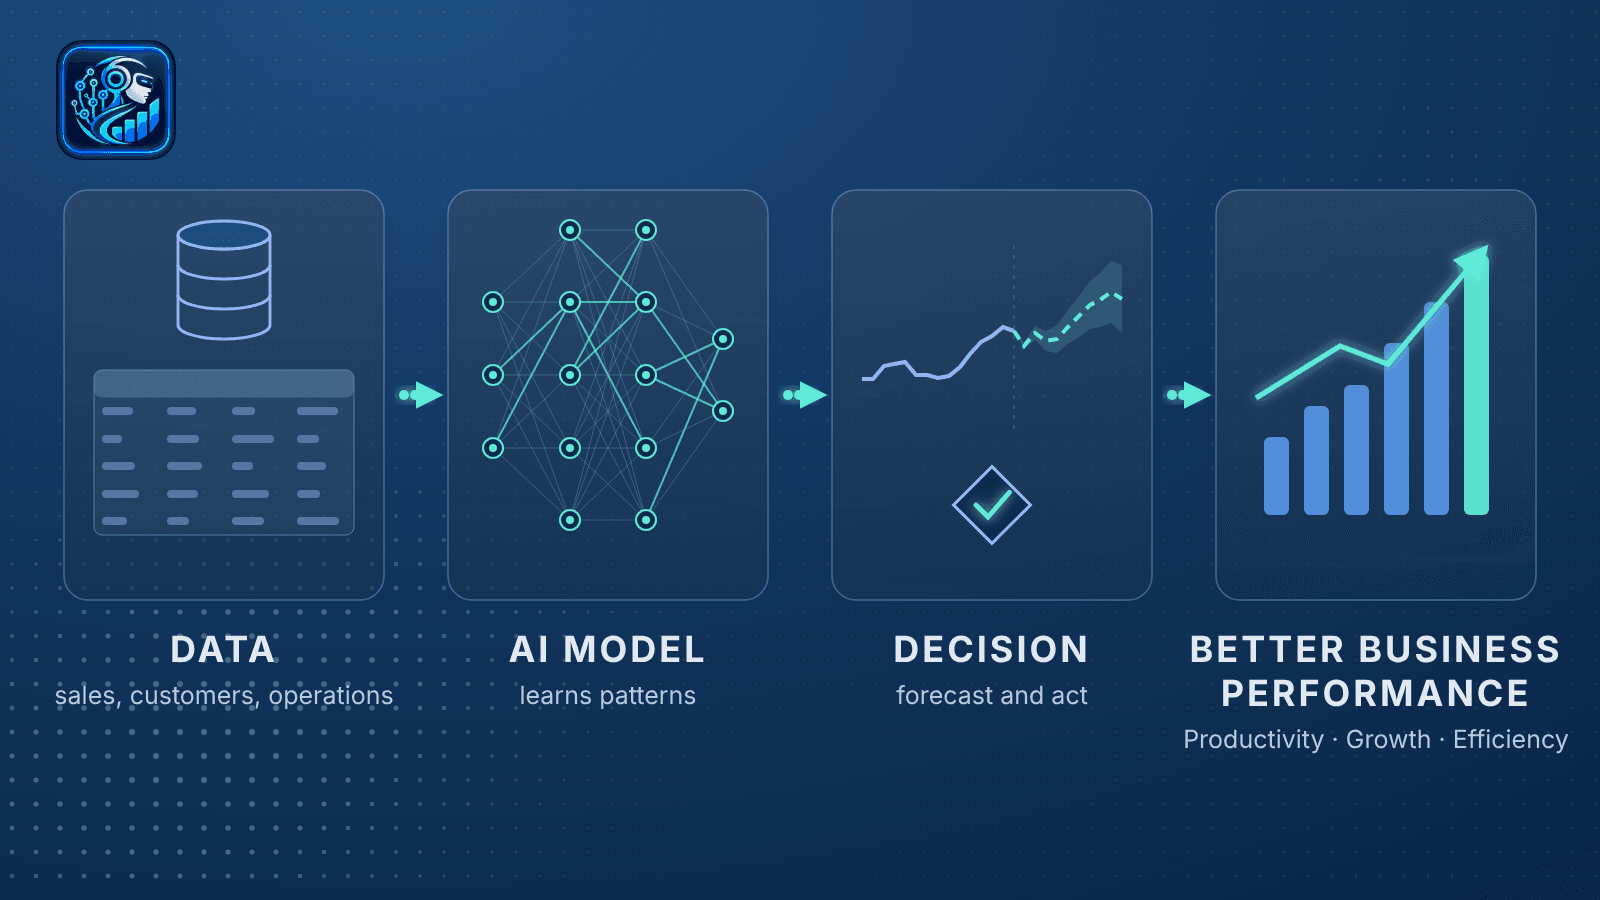
This article is based on the research review "How AI-Driven Data Analysis Improves Business Performance: A Review of the Evidence" by Akbar Mohseni, PhD (Northstat AI Solutions, updated October 29, 2026). The findings, references and conclusions are the review's own; the update adds Canadian adoption figures for the second quarter of 2026 from Statistics Canada [19]. The figures and Table 1 below are the same as in the complete report, which is available as a PDF.
Download the full research report (PDF)
The complete review by Akbar Mohseni, PhD, with all references, the same figures and Table 1. Updated October 29, 2026 with Statistics Canada's Q2 2026 adoption figures.
Key findings
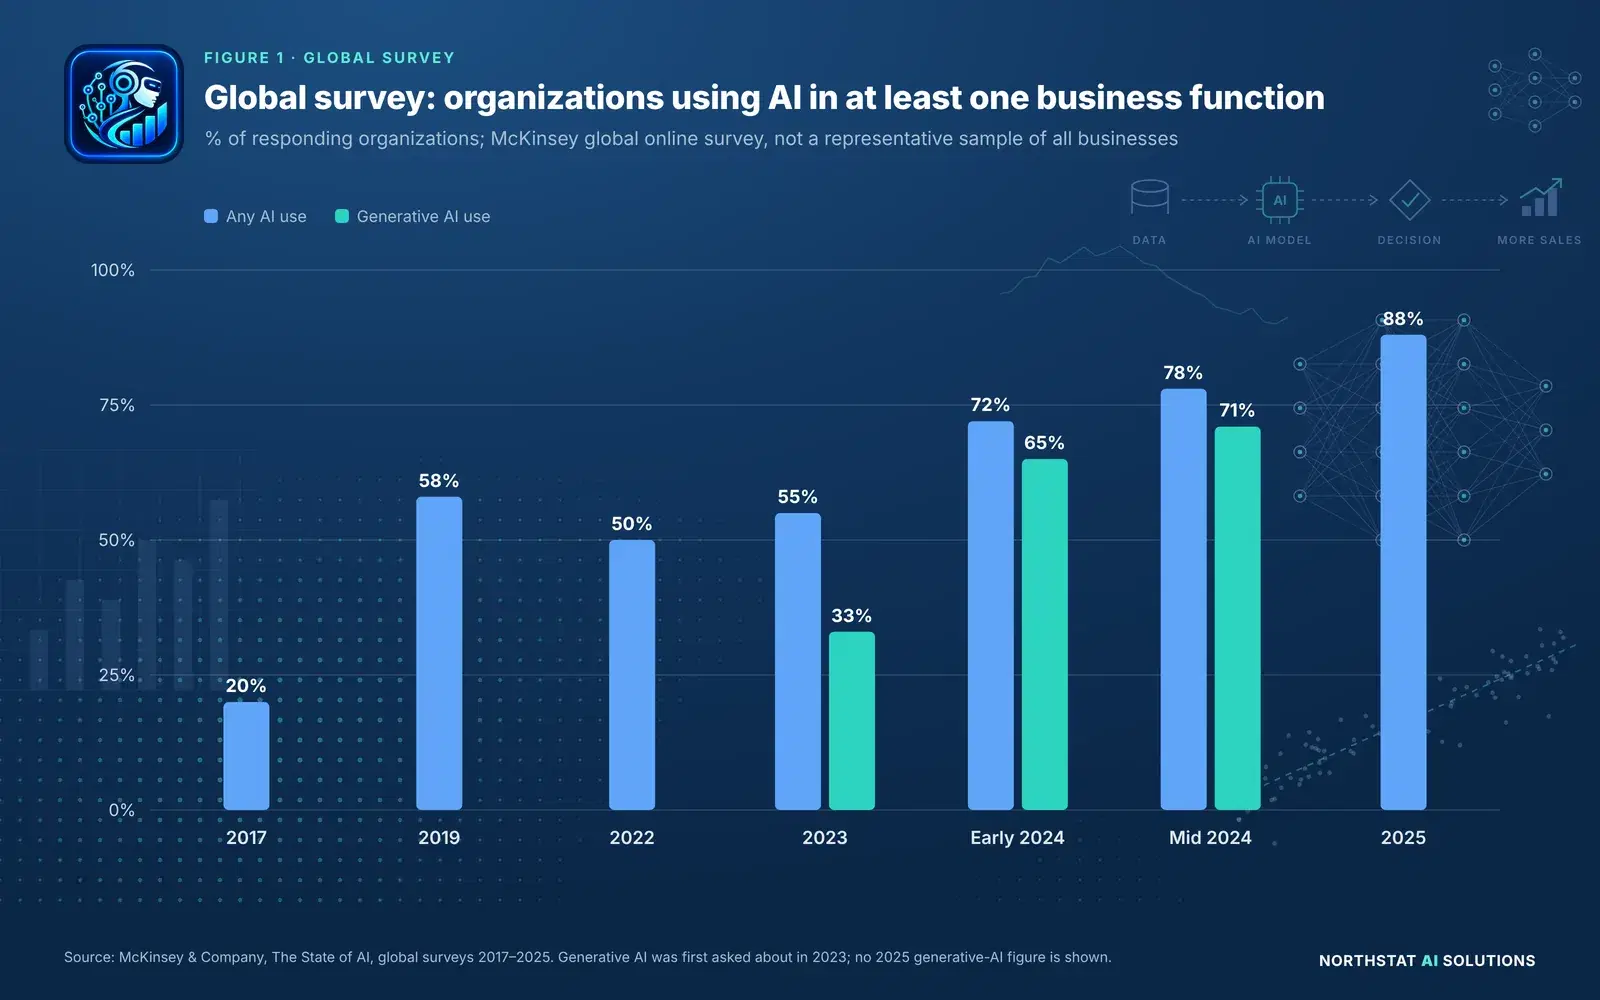
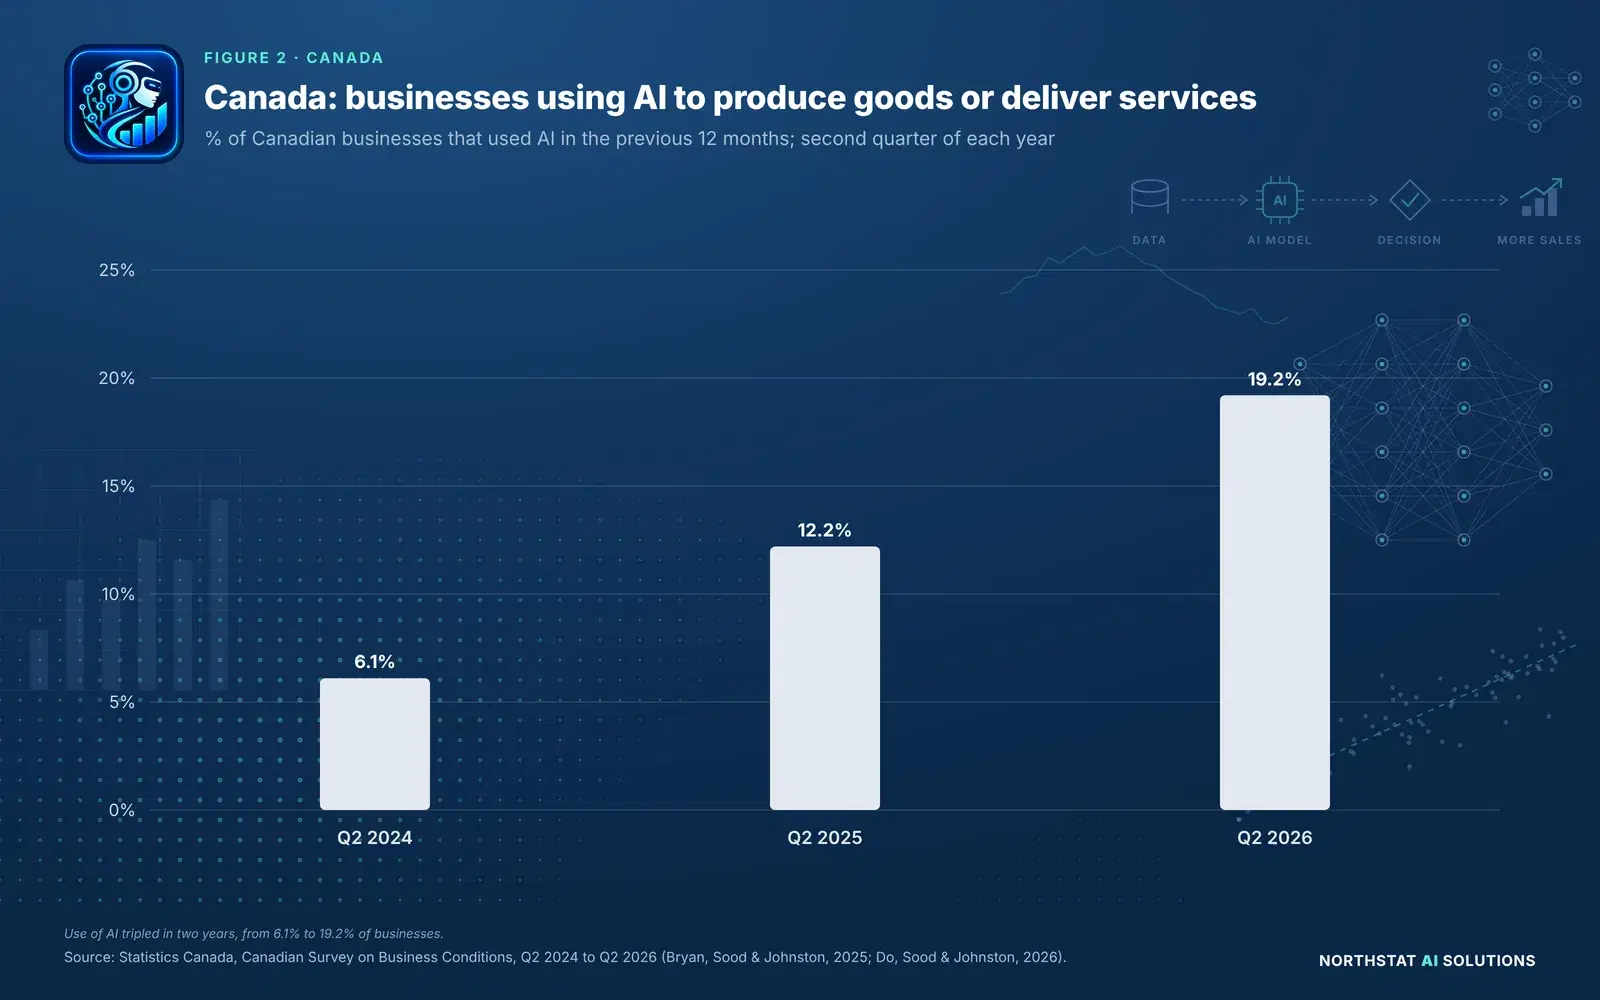
- Adoption is rising fast but unevenly. In a 2025 global survey, 88% of responding organizations reported using AI in at least one business function [1]. In Canada, 19.2% of businesses used AI to produce goods or deliver services in the 12 months before the second quarter of 2026, up from 12.2% a year earlier and 6.1% in 2024 [2], [19]. These two figures measure different things (see below).
- Firm-level gains are real but modest. Firms that base decisions on data show output and productivity 5% to 6% higher than expected from their other investments [3]. Big data and analytics assets are associated with 3% to 7% higher productivity, but only in IT-intensive or highly competitive industries [5]. These are statistical associations, not proof of cause.
- Specific tools can have larger, measurable effects. In randomized field experiments, a generative AI pre-sale chatbot raised sales by 16.3% on one online retail platform, while several other AI tools had small or no significant effects [10]. AI assistance raised customer-support productivity by 14% on average and 34% for novice agents [13].
- Results depend on conditions. Data quality, skills, industry, human oversight and how customers perceive AI all change the outcome [5], [11], [12], [15], [18].
How to read the evidence labels in this article
- Research findingWhat a survey, statistical release or benchmark competition reported. Describes the situation; does not show cause.
- Statistical associationA statistical relationship in observational data, for example between analytics use and productivity. Other factors may explain part of it.
- Causal evidence (randomized experiment)A randomized experiment compared a group using the AI tool with a control group, so the difference can be attributed to the tool in that setting.
- Hypothetical calculationAn illustration built from assumptions and synthetic numbers. Not research, not a forecast and not a client result.
Why this question matters
The use of data to guide business decisions spread quickly in the early 2010s: the share of U.S. manufacturing plants using data-driven decision-making nearly tripled, from 11% to 30%, between 2005 and 2010 [4]. AI has since extended data analysis from describing the past to predicting outcomes and generating content [16]. AI use in at least one business function rose from 78% to 88% of surveyed organizations between 2024 and 2025, and marketing and sales, together with IT, has been one of the functions where respondents most often report AI use [1]. Generative AI alone has been estimated to add $2.6 trillion to $4.4 trillion in annual economic value across 63 use cases [16]; that is a modelled estimate of potential, not a measured result.
Managers therefore need evidence on whether, where and under what conditions AI-based data analysis improves performance [5], [8]. The review asks one question: what does recent empirical research show about the effect of AI-based data analysis on business performance?
How the review was done
It is a narrative (non-systematic) review of 18 studies and reports published between 2011 and 2026 [1]–[18], with Statistics Canada's 2026 release added in the October 29 update [19]. Sources were identified in October 2026 through searches of journal sites, SSRN, NBER, arXiv, RePEc and publisher pages. Studies were included if they reported an empirical estimate of AI or analytics effects on a business outcome such as productivity, sales, growth or forecast accuracy. Randomized experiments and peer-reviewed econometric studies were given more weight than surveys; industry surveys were used to describe adoption, not to estimate causal effects. Figures are taken as stated in each source.
Who is using AI: global and Canadian data
Two widely quoted sources describe AI adoption, and they give very different numbers.
Show the data as a table
| Survey | Any AI use (%) | Generative AI use (%) |
|---|---|---|
| 2017 | 20 | – |
| 2019 | 58 | – |
| 2022 | 50 | – |
| 2023 | 55 | 33 |
| Early 2024 | 72 | 65 |
| Mid 2024 | 78 | 71 |
| 2025 | 88 | not shown |
Show the data as a table
| Survey period | Businesses using AI (%) |
|---|---|
| Q2 2024 | 6.1 |
| Q2 2025 | 12.2 |
| Q2 2026 | 19.2 |
The Canadian figure has tripled in two years [2], [19]. Use is concentrated: businesses in information and cultural industries (42.3%), finance and insurance (40.4%), and professional, scientific and technical services (32.4%) were the most likely to use AI in the second quarter of 2026, while agriculture, forestry, fishing and hunting (4.5%), wholesale trade (7.9%) and construction (9.2%) were the least likely [19]. Larger businesses use AI more often: 27.8% of businesses with 100 or more employees reported AI use, compared with 19.9% of businesses with 1 to 4 employees [19]. Use was also higher in urban areas (21.0%) than in rural areas (9.9%) [19].
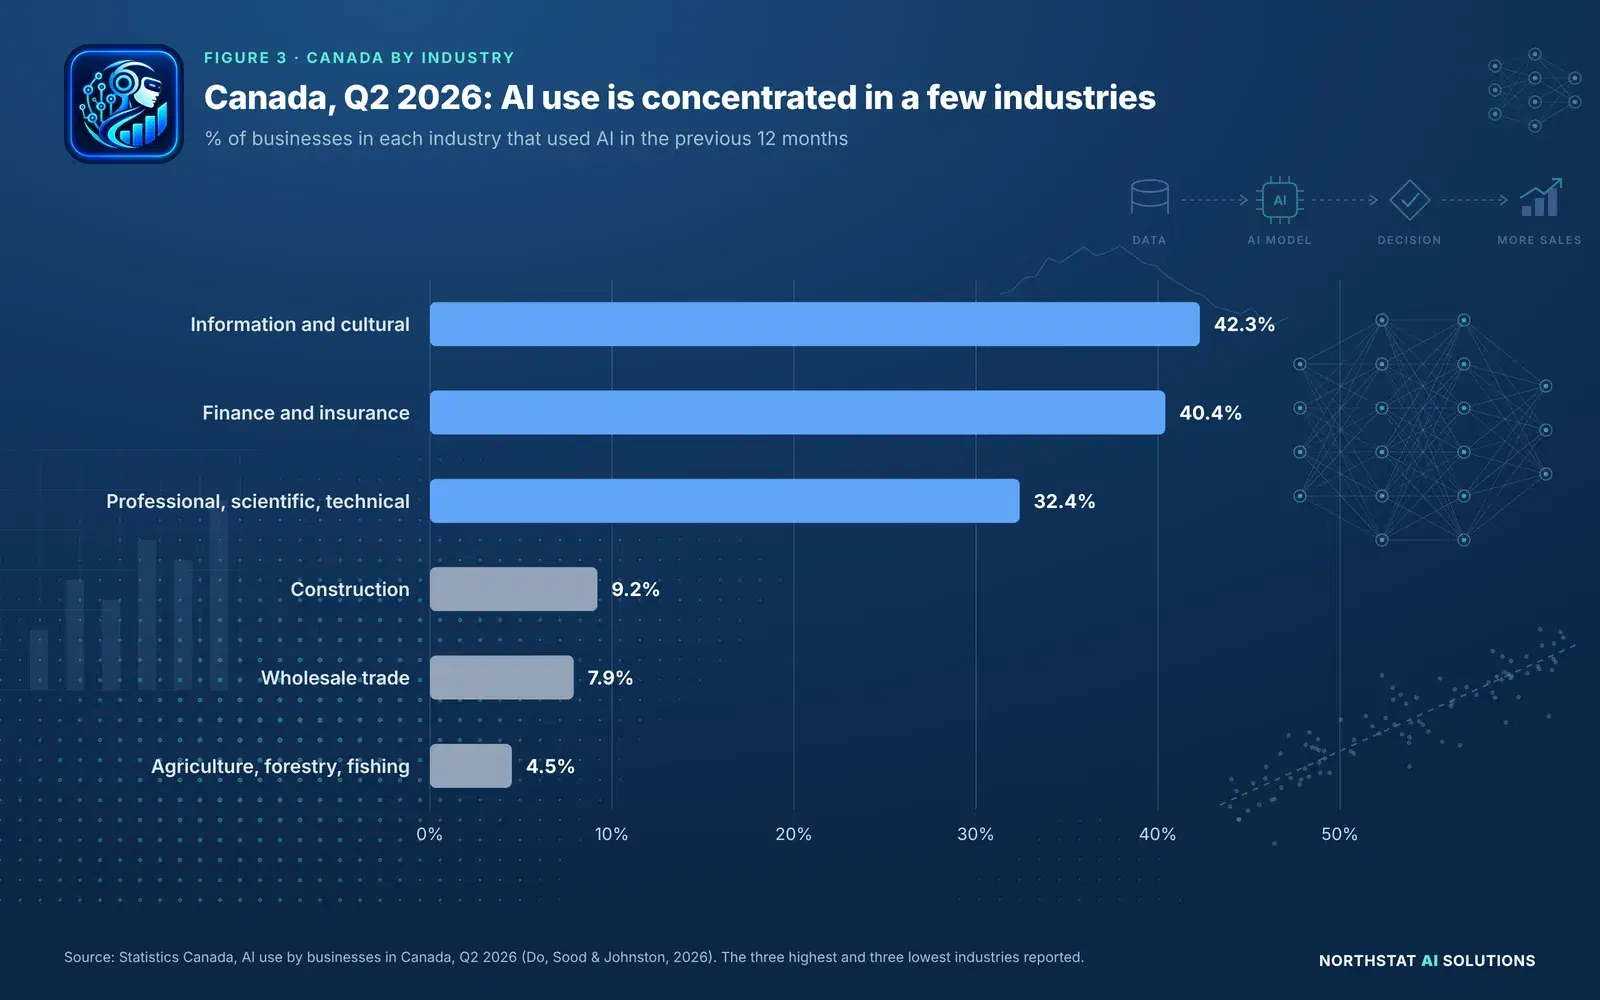
Show the data as a table
| Industry | Businesses using AI (%) |
|---|---|
| Information and cultural | 42.3 |
| Finance and insurance | 40.4 |
| Professional, scientific and technical | 32.4 |
| Construction | 9.2 |
| Wholesale trade | 7.9 |
| Agriculture, forestry, fishing and hunting | 4.5 |
Why the McKinsey and Statistics Canada figures cannot be compared directly
It is tempting to read "88% globally versus 19.2% in Canada" as a gap of almost 70 points. That comparison is not valid, for four reasons:
- Different populations. McKinsey's figure comes from an online survey of 1,993 participants from organizations around the world [1]. It is not designed to represent all businesses, and the original review characterizes its respondents as mostly from larger firms. Statistics Canada's Canadian Survey on Business Conditions produces estimates for the Canadian business population as a whole, which is made up mostly of small businesses [19].
- Different questions. McKinsey asks whether an organization uses AI in at least one business function [1]. Statistics Canada asks whether the business used AI to produce goods or deliver services in the previous 12 months [19]. An organization experimenting with AI in one back-office function could count in the first survey but not in the second.
- Different unit of measurement. McKinsey reports the share of survey respondents' organizations [1]. Statistics Canada reports an estimate for the business population as a whole [19].
- Different geography and timing. One is global and the other covers Canada only. They were also collected in different months [1], [19].
What the two sources do support is narrower: AI use is widespread among the larger organizations that respond to global executive surveys, and it is growing quickly but is still a minority practice across Canadian businesses as a whole.
Data-driven decisions, productivity and growth
Statistical association
Firms that adopt data-driven decision-making have output and productivity 5% to 6% higher than expected given their other investments and IT use [3]. The same study links data-driven decision-making to higher asset utilization, return on equity and market value, and uses instrumental-variable estimates to argue that the productivity effect is not explained by reverse causality [3]. In a panel of 814 firms from 2008 to 2014, big data and analytics assets were associated with an average productivity improvement of 3% to 7% [5]. These gains appeared in IT-intensive or highly competitive industries; no measurable improvement was detected for other firms [5]. A survey of 297 IT managers and business analysts in China found that big data analytics capability improves firm performance both directly and through process-oriented dynamic capabilities [6].
In German firm data, both the adoption of AI and the intensity of AI use are positively and significantly associated with firm productivity [7]. Firms that invest in AI experience higher growth in sales, employment and market valuation, primarily through increased product innovation [8]. The gains are concentrated among larger firms [8].
These studies observe firms rather than assigning AI at random, so they show associations. Several use statistical techniques to reduce the risk of reverse causality [3], [7], [8], but other differences between firms may still explain part of the results.
Forecasting
Research finding (benchmark competition)
The M5 competition asked participants to forecast 42,840 hierarchical unit-sales series from Walmart [9]. It attracted 7,092 participants on 5,507 teams from 101 countries [9]. The winning method improved accuracy by 22.4% over the most accurate statistical benchmark, and most top methods used the LightGBM machine learning algorithm [9]. This is a measure of forecast accuracy on historical data, not a measure of sales or profit.
Sales and marketing
Causal evidence (randomized experiment)
In randomized field experiments on a large cross-border retail platform, a generative AI pre-sale chatbot increased sales by 16.3% [10]. Other generative AI tools in the same study had smaller effects, from +2.9% for search query refinement to no statistically significant effect for advertising titles [10]. Less experienced consumers benefited disproportionately [10].
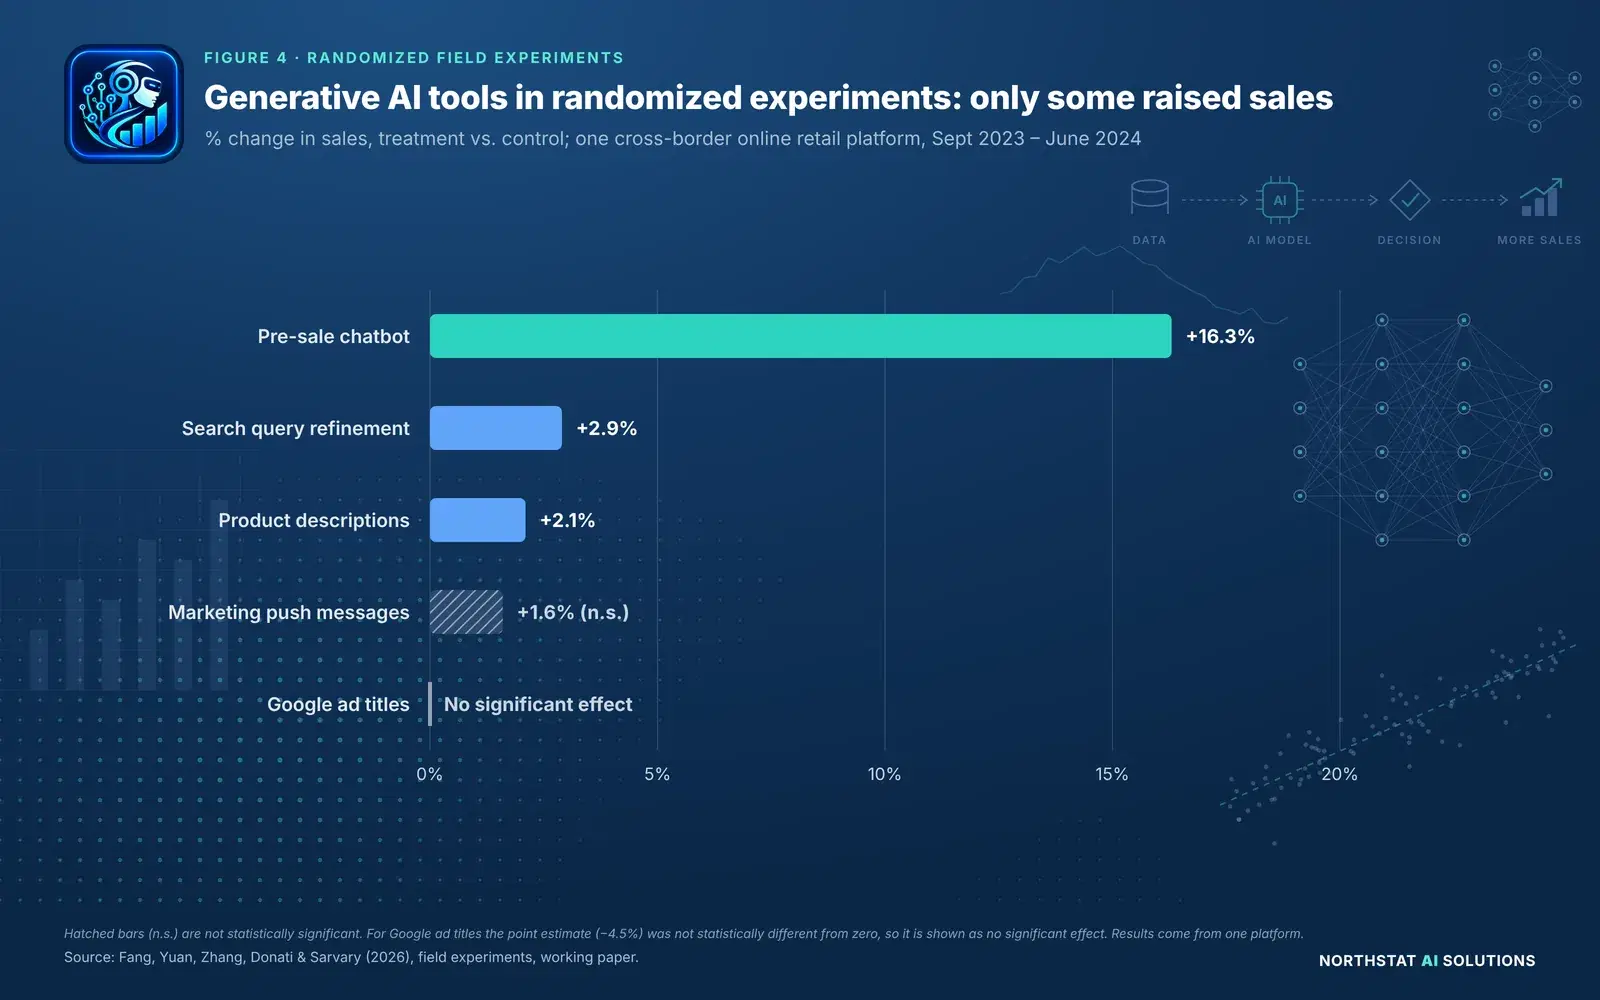
Show the data as a table
| AI tool | Change in sales | Statistically significant? |
|---|---|---|
| Pre-sale chatbot | +16.3% | Yes |
| Search query refinement | +2.9% | Yes |
| Product descriptions | +2.1% | Yes |
| Marketing push messages | +1.6% | No |
| Google ad titles | No significant effect (point estimate −4.5%) | No |
In outbound sales calls, undisclosed AI chatbots were as effective as proficient workers and four times more effective than inexperienced workers in generating purchases [11]. But disclosing the chatbot before the conversation reduced purchase rates by more than 79.7% [11]. AI coaching of sales agents had an inverted-U effect: middle-ranked agents improved most, while bottom-ranked agents faced information overload and top-ranked agents showed aversion to AI [12].
Research finding (self-reported surveys)
In a survey of 5,500 sales professionals, 83% of sales teams using AI reported revenue growth, compared with 66% of teams without AI [18]. Among firms using generative AI in marketing and sales, 66% reported revenue increases from it in that function in July 2024 [17]. These surveys compare adopters with non-adopters and rely on self-reports, so they do not establish cause [17], [18].
Worker productivity
Causal evidence (randomized experiments)
AI assistance increased customer-support productivity, measured as issues resolved per hour, by 14% on average across 5,179 agents [13]. The gain was 34% for novice and low-skilled workers, with minimal impact on experienced and highly skilled workers [13]. In an experiment with 444 college-educated professionals, ChatGPT reduced the time taken on writing tasks by 0.8 standard deviations and raised output quality by 0.4 standard deviations [14]. Consultants using AI completed 12.2% more tasks and worked 25.1% faster on tasks within AI's capabilities [15], but the share of correct answers fell by 19% on tasks beyond those capabilities [15].
Effect sizes, outcome by outcome
The original report showed the main effect sizes in a single chart. Here they are separated by outcome, because the studies measure different things in different units and on different populations.
Each row measures a different outcome in a different unit, so values should not be compared across rows. A 22.4% gain in forecast accuracy is not comparable with a 16.3% gain in sales or a 14% gain in issues resolved per hour.
| Outcome | Measured as | Study or setting | Reported effect | Design |
|---|---|---|---|---|
| Firm productivity | Output and productivity relative to other investments and IT use | Data-driven decision-making [3] | 5–6% | Statistical association |
| Firm productivity | Average productivity improvement, 814 firms | Big data and analytics assets (IT-intensive or highly competitive industries) [5] | 3–7% | Statistical association |
| Sales | Change in sales versus a randomized control group | Generative AI pre-sale chatbot, one online retail platform [10] | +16.3% | Randomized experiment |
| Sales forecast accuracy | Accuracy gain of the winning method over the best statistical benchmark | M5 forecasting competition, Walmart unit sales [9] | 22.4% | Forecasting competition |
| Customer-support productivity | Issues resolved per hour | AI assistant, 5,179 agents (all agents; novice and low-skilled agents) [13] | +14%; +34% | Staggered rollout (quasi-experiment) |
| Consultant task output | Tasks completed; time taken; correct answers outside AI's capabilities | Consultants using AI [15] | +12.2%; 25.1% faster; −19% | Randomized experiment |
| Professional writing | Standard deviations (SD) of time taken and of graded quality | ChatGPT, 444 college-educated professionals [14] | −0.8 SD time; +0.4 SD quality | Randomized experiment |
The methods behind AI-driven data analysis, in plain English
The studies above rely on a small set of statistical and machine learning methods. None of them is magic; each answers a specific kind of question.
Regression
Regression estimates how one quantity changes with others. For example, how weekly sales move with price, promotions and season. It produces a number for each factor (an invented illustration: "a 1% price cut is associated with a 1.8% rise in units sold") and a measure of uncertainty around it. On observational data, regression shows association; it shows cause only when the data come from an experiment or a carefully justified research design.
Time-series forecasting
Time-series forecasting predicts future values of something measured over time, such as daily orders or monthly revenue, by learning trend, seasonality and the effect of known drivers. Good forecasts come with a range, not a single number, and are always compared with a simple baseline such as "same week last year". The M5 competition is an example of methods being tested this way [9].
Gradient boosting
Gradient boosting builds many small decision trees, each one correcting the errors of the trees before it. It handles many inputs and non-linear patterns well and is fast to train. LightGBM, used by most top methods in the M5 competition, is a gradient boosting library [9]. Its predictions can be very accurate but are harder to explain than a regression, so they need careful testing.
Classification
Classification predicts which category something belongs to: whether a lead is likely to buy, whether a transaction looks fraudulent, whether a customer is likely to leave. The output is usually a probability. Accuracy alone can mislead when one outcome is rare, so it is judged with measures such as precision (how many flagged cases were right) and recall (how many real cases were caught).
Model validation
Validation checks whether a model works on data it has not seen. The basic rule is to hold back data, often the most recent period, train on the rest and compare predictions with what actually happened. Backtesting repeats this over several cut-off dates. Cross-validation repeats it over different slices of the data. A model is worth using only if it beats a simple baseline on held-out data, and its effect on a business outcome is best confirmed by a controlled test like the experiments in this review [10], [13].
What the evidence means for business decisions
Across study designs, the evidence points in one direction: AI-based data analysis is associated with better business performance, with typical firm-level productivity gains in the low single digits [3], [5], [7]. Task-level and transaction-level effects are larger [9], [10], [13], [15], but they are measured on specific tasks and are not firm-wide results.
Three mechanisms recur in the literature [9], [13], [8]:
- Better predictions for operational decisions, as shown by machine learning outperforming statistical benchmarks in retail sales forecasting [9].
- Spreading expertise from the best workers to less experienced ones, which is why novice support agents gained most [13].
- Growth through new products, not only cost savings, since AI-investing firms grow mainly through product innovation [8].
The benefits depend on complementary conditions. Analytics assets raised productivity only in IT-intensive or highly competitive industries [5]. Analytics capability works partly through a firm's ability to reconfigure its processes [6]. Human oversight matters [12], customer perception matters [11], and data quality is a practical constraint: only 35% of sales professionals fully trust the accuracy of their organization's data [18].
For managers, the review suggests starting with applications close to the customer decision, such as pre-sale assistance and forecasting, where measured effects are largest [9], [10]. It also suggests testing each AI tool against a control group, because several plausible tools showed no significant sales effect in randomized tests [10].
Want to test whether AI-driven analysis would help your business?
A short consultation can identify one decision worth improving, the data available for it and how to measure the result against a control group before any wider rollout.
Try the arithmetic: a hypothetical business impact calculator
Hypothetical calculation
The calculator below shows how an assumed change in conversion rate would translate into sales, profit and payback. It uses synthetic example data. Its starting values are invented, it does not use any study's results and it is not based on any Northstat client. The research above shows that real effects range from large to zero, so the most useful output is often the break-even figure: how much improvement a tool would need just to cover its cost.
Business impact calculator
The starting values are invented for illustration. They are not Northstat client results, not research findings and not a prediction of what any tool will achieve. Replace them with your own figures.
Illustrative result for the assumptions above
- Conversion rate
- 2.5% → 2.625%
- Additional annual sales
- $50,000
- Additional annual gross profit
- $15,000
- First-year net after implementation cost
- -$10,000
- Payback period
- 20 months
- Break-even improvement in conversion
- 8.3%
Method: additional sales = baseline sales × assumed relative improvement (traffic and average order value held constant); gross profit = additional sales × margin; payback = cost ÷ monthly additional profit; break-even improvement = cost ÷ (baseline sales × margin). Ignores ramp-up time, ongoing costs after year one, taxes and the chance that the effect is zero. Test any tool against a control group before relying on a figure like this.
Limitations
This review is narrative rather than systematic, so the selection of studies may not represent the full literature. Several included studies are working papers that had not completed peer review when they were read [3], [10], [15]. The observational studies estimate associations, even where instrumental variables are used to address reverse causality [3], [7], [8]. Survey reports from consulting firms and software vendors compare adopters with non-adopters and do not establish cause [1], [17], [18]. Outcomes differ across studies, from productivity indices to sales and forecast error, so effect sizes are not directly comparable [3], [9], [10], [13]. Much of the evidence comes from large firms or large platforms, while most Canadian businesses do not yet use AI [8], [10], [19]. Future research should test AI-based analytics in small and mid-sized firms and report long-run effects on sales and profit [2], [8].
Conclusion
Empirical research from 2011 to 2026 shows that analyzing business data with AI improves productivity, forecasting accuracy, sales conversion and worker output [3], [5], [9], [10], [13]. The size of the gain depends on industry context, data assets, worker experience and how humans and AI share the work [5], [12], [13], [15]. Firms that combine AI with good data and human oversight, and that measure results against a control group, are best placed to capture these benefits [5], [10], [12].
If you are considering where AI-driven analysis could help, Northstat's work in decision intelligence, predictive analytics, business intelligence, data engineering and AI strategy starts with the same principles: clean data, a simple baseline and a measured test. Request a consultation to discuss your situation.
References
- McKinsey & Company. (2025, November 5). The state of AI in 2025: Agents, innovation, and transformation. Global survey, 1,993 participants.
- Bryan, V., Sood, S., & Johnston, C. (2025, June 16). Analysis on artificial intelligence use by businesses in Canada, second quarter of 2025 (Catalogue no. 11-621-M2025008). Statistics Canada.
- Brynjolfsson, E., Hitt, L. M., & Kim, H. H. (2011). Strength in numbers: How does data-driven decisionmaking affect firm performance? SSRN Working Paper.
- Brynjolfsson, E., & McElheran, K. (2016). The rapid adoption of data-driven decision-making. American Economic Review, 106(5), 133-139.
- Müller, O., Fay, M., & vom Brocke, J. (2018). The effect of big data and analytics on firm performance: An econometric analysis considering industry characteristics. Journal of Management Information Systems, 35(2), 488-509.
- Wamba, S. F., Gunasekaran, A., Akter, S., Ren, S. J., Dubey, R., & Childe, S. J. (2017). Big data analytics and firm performance: Effects of dynamic capabilities. Journal of Business Research, 70, 356-365.
- Czarnitzki, D., Fernández, G., & Rammer, C. (2023). Artificial intelligence and firm-level productivity. Journal of Economic Behavior and Organization, 211, 188-205.
- Babina, T., Fedyk, A., He, A., & Hodson, J. (2024). Artificial intelligence, firm growth, and product innovation. Journal of Financial Economics, 151, 103745.
- Makridakis, S., Spiliotis, E., & Assimakopoulos, V. (2022). M5 accuracy competition: Results, findings, and conclusions. International Journal of Forecasting, 38(4), 1346-1364.
- Fang, L., Yuan, Z., Zhang, K., Donati, D., & Sarvary, M. (2026). Generative AI and firm productivity: Field experiments in online retail (arXiv:2510.12049v3).
- Luo, X., Tong, S., Fang, Z., & Qu, Z. (2019). Frontiers: Machines vs. humans: The impact of artificial intelligence chatbot disclosure on customer purchases. Marketing Science, 38(6), 937-947.
- Luo, X., Qin, M. S., Fang, Z., & Qu, Z. (2021). Artificial intelligence coaches for sales agents: Caveats and solutions. Journal of Marketing.
- Brynjolfsson, E., Li, D., & Raymond, L. R. (2025). Generative AI at work. Quarterly Journal of Economics, 140(2), 889-942.
- Noy, S., & Zhang, W. (2023). Experimental evidence on the productivity effects of generative artificial intelligence. Science, 381(6654). Working paper version read.
- Dell'Acqua, F., McFowland, E., Mollick, E. R., Lifshitz-Assaf, H., Kellogg, K., Rajendran, S., Krayer, L., Candelon, F., & Lakhani, K. R. (2023). Navigating the jagged technological frontier: Field experimental evidence of the effects of AI on knowledge worker productivity and quality (HBS Working Paper No. 24-013). Harvard Business School.
- McKinsey & Company. (2023, June 14). The economic potential of generative AI: The next productivity frontier.
- McKinsey & Company. (2025, April 30). Gen AI's ROI [Chart; survey of 1,491 participants, July 16-31, 2024].
- Salesforce. (2024, July 25). Salesforce report: Sales teams using AI 1.3x more likely to see revenue increase [State of Sales, 6th ed.; 5,500 respondents].
- Do, V., Sood, S., & Johnston, C. (2026, June 11). Analysis on artificial intelligence use by businesses in Canada, second quarter of 2026 (Catalogue no. 11-621-M, no. 2026010). Statistics Canada.
Written by
Akbar Mohseni, PhD
Founder, Northstat AI Solutions Inc.